Atradius Atrium
Få adgang til vores onlinesystem, som samler alle jeres daglige værktøjer i ét system.

 Danmark
 Australien
 Belgien
 Brazil
 Bulgarien
 Canada
Danmark
Canada
Danmark
 Finland
 Frankrig
 Grækenland
 Holland
 Hong Kong SAR
 Indien
 Irland
 Italien
 Japan
Japan
 Kina
Kina
 Litauen
 Mexico
 New Zealand
 Norge
Norge
 Østrig
 Polen
Polen
 Portugal
 Rumænien
 Schweiz
 Singapore
 Slovakiet
 Slovenien
 Spain
Spain
 Storbritannien
 Sverige
 Tjekkiet
 Tyrkiet
 Tyskland
 Ungarn
 USA
USA


Visning 7 ud af 59
Insolvency pressures persist in 2026


Strong payment discipline on the surface hides payment risk hotspots that need close attention and proactive risk management

The escalation of the US trade war one year ago marked a structural shift toward US protectionism and trade policy...

Production growth in 2026, but below its potential
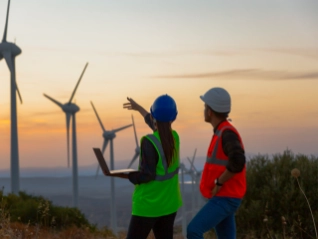
The global energy transition is slowing, raising climate and financial risks for fuel-importing countries

A fractured outlook of declining demand and above average growth
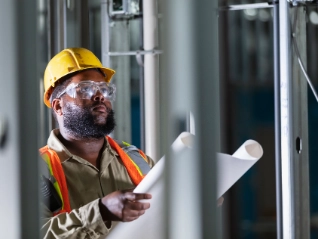
Tariff-related economic uncertainty still weighs on commercial construction activity
Visning 7 ud af 216


