Post-pandemic adjustments or an adverse new normal?
Summary
- In 2023 we observed a surge in insolvencies, with our global index showing an increase of 32%. For most markets this increase reflected ongoing post-pandemic adjustments after three years of persistently low levels. For the other remaining markets insolvencies have stabilised at a level above pre-pandemic, suggesting the emergence of an adverse new normal where companies face higher interest rates and lower demand.
- Our forecast for 2024 and 2025 is driven by the degree of adjustment to pre-pandemic levels in the markets where the normalisation is still in progress and by purely economic factors where a stabilisation to the new normal has already occurred.
- Overall, we expect globally in 2024 an increase of 16%, followed by a minor decrease of 1% in 2025.
- However, there is a wide variation in the growth rates across markets. We expect high increases in the markets where the adjustment from low levels still has to occur (such as Singapore, Italy, the Netherlands, Poland and the United States).
- Conversely, we forecast high decreases in markets where insolvencies already overshoot their pre-pandemic levels (such as South Korea, Ireland, Canada and Finland).
- Finally, in markets where insolvencies seem to have stabilised (such as Czech Republic, Austria, Belgium, Romania, Norway, United Kingdom) we expect smaller fluctuations.
Challenging economy clouds businesses’ ‘return to normal’
Global insolvencies are soaring as businesses grapple with the double whammy of sputtering economic activity and the phasing out of pandemic-era support. After increasing by a staggering 32% in 2023, insolvencies are virtually back to their level from 2019. But we don’t expect to see insolvencies stabilise just yet. Instead, we project another substantial rise of 16% in 2024, followed by a stabilisation in 2025.
For most markets, the post-pandemic surge in insolvencies is still ongoing and it is difficult to assess whether this is a post pandemic adjustment or whether it will lead to a stabilisation to an adverse new normal. During the pandemic insolvencies contracted massively almost across all markets as a result of the government support. Thus, we believe that the rise in insolvencies in the most recent data is to a large extent still due to post-pandemic related adjustment. However, for a minority of markets we do see insolvencies stabilising at levels higher than before the pandemic, which makes us believe that the current economic environment is also contributing to the formation of an adverse new normal.
The post-pandemic economic recovery has largely run its course and the global economy is losing steam, with growth slowing 0.3 percentage points to 2.4% this year. Inflation has eased but not yet confidently to target rates. As such, central banks are still cautious to loosen their policies, keeping interest rates at high levels at least until later this spring. Therefore, the pressure that businesses face from higher interest rates will persist this year and may only see relief in 2025, given the lagged effect of monetary policy. The latest bank lending surveys in the both the US and eurozone for instance both showed expectations of further tightening of lending standards for companies in the coming months. This adds even more pressure for firms as the cash buffers that many companies amassed during the pandemic have now been largely exhausted. With less capacity to mitigate the effects of the broader economic slowdown, we anticipate higher insolvencies in the coming years.
2023 brings an overall increase in insolvencies, with a wide variation across markets
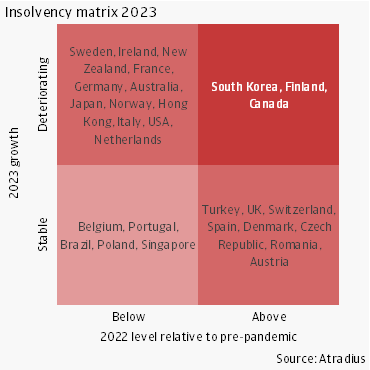
Out of the 29 markets that we monitor in this report, 24 registered increases in insolvencies. To better visualise the insolvencies snapshot for 2023, we classify markets across two dimensions. First, we group countries into “stable” and “deteriorating” depending on their insolvencies growth rate for 2023. If the growth rate falls into the -15%/+15% interval, then we consider that country as “stable”, while a growth rate higher than 15% we assign as “deteriorating”. There were no countries with a growth rate lower than -15%, so the “stable” and “deteriorating” groups cover all the countries in our sample.
Second, we group countries depending on their average insolvency level in 2022 relative to their pre-pandemic level. This is important for interpreting whether the 2023 dynamics are due to pandemic related adjustments or due to additional factors in the economic environment such as high interest rates or lower demand. During the pandemic, we witnessed insolvencies decreasing almost across all markets as a result of the strong government support. Therefore, a still low level of insolvencies in 2022 relative to the pre-pandemic indicates that a positive growth rate for 2023 is contributing to an adjustment to pre-pandemic levels.
We use as a reference the 2019 mean insolvency level. If the insolvencies in a given market have reached at least 95% of this reference level, we classify insolvencies in that market as “above” the normal, while in the opposite case it is “below” the normal.
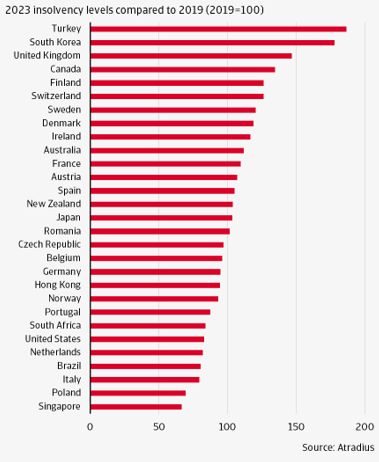
Applying these two classifications, we can group countries in four quadrants that are reproduced in the matrix in figure 1. Additionally, to assess the overall riskiness of a given market relative to the pre-pandemic, we compute in figure 2 the 2023 mean insolvency levels relative to the mean 2019 insolvency level.

Figure 1 Insolvencies deteriorate in 2023 mostly in markets that started out with a low insolvency level relative to pre-pandemic
The main message from figure 1 is that insolvencies deteriorated in 2023 mostly across the markets where their level relative to pre-pandemic was still low. In other words, the deterioration of insolvencies that we see in the aggregate is to a large part still related to the normalisation to pre-pandemic levels. This is visible in our figure as most markets marked as “deteriorating” are grouped in the north-west quadrant. Here the largest adjustments were experienced by the Netherlands, United States, Hong Kong, Japan and France, all countries with very low insolvency numbers at the start of 2023. Figure 2 shows that in 2023 for most of these markets, insolvencies remained below or slightly overshot their pre-pandemic level. Thus, the default risk remained comparable to the pre-pandemic period. Still, in a few cases, namely Sweden, Ireland and Australia, insolvencies considerably overshot their pre-pandemic levels, indicating an elevated default risk.

Figure 2 Average insolvency levels in 2023 relative to pre-pandemic still vary considerably across markets
Figure 1 also shows that there is a minority of markets that started 2023 with insolvency levels already above the pre-pandemic level and that increased further in 2023. In this group fall only three countries, South Korea, Finland and Canada. Figure 2 shows that these markets are among the top ranked in terms of the overall default risk in 2023 and that this is considerably higher relative to the pre-pandemic period. Our interpretation is that the surge of insolvencies in these countries is relatively short-lived as it is coming from defaults in zombie companies that survived throughout the pandemic. We define zombie companies as those companies that would have defaulted in normal times but were saved by the pandemic related government support.
Next, figure 1 shows that there is a substantial number of countries where insolvencies seem to have stabilised. In the south-east quadrant we group the countries with insolvencies that stabilised around or above our pre-pandemic reference. Here we note Turkey, United Kingdom, Switzerland and Spain that ended up in 2023 with a particularly high level of insolvencies relative to 2019. We interpret that insolvencies in these countries reached a new normal, higher than the pre-pandemic, due to the adverse economic conditions that they are facing.
Conversely, in the southwest quadrant we see a group of 5 countries where insolvencies remained relatively stable at low levels relative to pre-pandemic. Our interpretation is that here companies were able to manage better the liquidity that they acquired during the pandemic. This is the case for Belgium, Singapore and Poland where insolvencies did increase, but at a slower pace. For Brazil we note that insolvencies stabilised early in the pandemic, as the government support towards companies was not that sizeable.
Outlook 2024 and 2025: remaining post-pandemic adjustments vs. stabilisation to the new normal
We now turn to our insolvency forecast for 2024 and 2025, which are given in year-on-year percentage changes (e.g., total for 2024 compared with total for 2023.
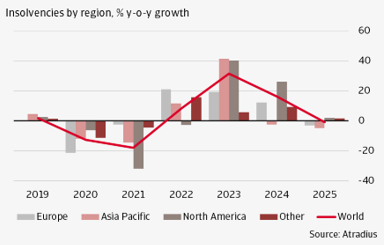
Figure 3 presents our forecasts aggregated for all markets and on a regional level. Globally, we predict that insolvencies increase by 16% year-on-year in 2024. We foresee a relatively strong increase of insolvencies in North America (25%), which is virtually driven by the United States. For Europe, we expect a somewhat smaller increase of 12% as the process of normalisation of insolvencies in most European countries is more advanced. For Asia Pacific we predict a relatively stable development overall, with a decrease of just 2%, as normalisation from high levels in some markets (e.g., South Korea) and from low levels in others (e.g., Singapore) mostly cancel off each other. In 2025 we see insolvencies slightly decreasing by 1%, reflecting decreases across all regions except North America.

Figure 3 Across regions, in 2024 insolvencies are expected to increase the most in North America
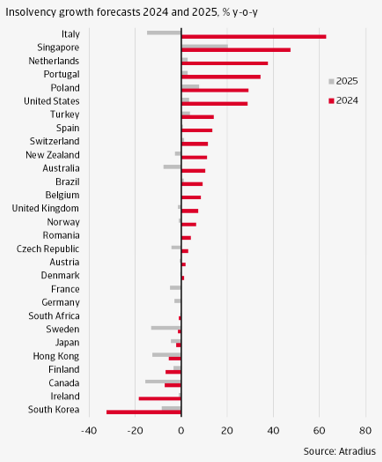
Figure 4 presents our insolvency forecast for 2024 and 2025 on a country level. The markets are arranged in the order of the growth rates for 2024 as these exhibit more variation. This is because we assume that most of the pandemic related adjustments will occur in 2024. The dynamics of our forecast for 2025 are therefore mostly associated with a normalised environment and are given by the dynamics of GDP across markets.

Figure 4 In 2024-2025, we still expect a wide variation of dynamics in insolvencies across markets, mostly reflecting the variation in the adjustment to pre-Covid levels at end-2023
The highest insolvency growth rates in 2024 are recorded in Italy, Singapore, the Netherlands, Portugal, Poland and United States. For all of these countries insolvencies were at the start of 2024 still below the normality level, as already shown in figure 2. Thus, we expect high increases in insolvencies for these markets in 2024 such that the normalisation is achieved. Italy is an exception in this group as it is the only country where we did not observe any signs of normalisation, with the latest available data up to 2023Q3. We see however no reasons that the normalisation should not start from 2023Q4.
At the other side of the spectrum, for countries with the highest decreases in insolvencies in 2024 are South Korea, Ireland, Canada and Finland. These experienced in 2023 a surge in insolvencies reaching levels higher than pre-pandemic. Therefore, we expect them to normalise downwards in 2024.
Finally, for the markets in the middle range in figure 4, the insolvencies growth rates for 2024-2025 are relatively small. For some of these insolvencies seem to have peaked and the downwards normalisation is expected to take place in 2024-2025 (Japan, Sweden, France, Germany, Denmark). For the others, insolvencies seem to have stabilised to the post-pandemic normal (Czech Republic, Austria, Belgium, Romania, Norway, Unite Kingdom) and their evolution is mostly given by the dynamics of the economic environment.
Iulian Ciobica, Economist
+31 20 553 2121
Dana Bodnar, Economist
+31 20 553 3165
Relaterede dokumenter

389.0KB PDF
